Founding membership · Opens Q1 2027
Forge your edge.
A clearer process for the opening hour — the busiest hour of the trading day — in the largest US stocks. Quantitative tools and practical education for day traders who know the basics.
TradingView indicator access · Morning Market Analysis · Recorded lessons · Community
Founding-member pricing for the waitlist — locked in for as long as you stay a member. Pricing is announced to the waitlist first.

Calculated zones. Informed decisions.
Our own indicator, a structured method, and the skill to put them together.
Proprietary quantitative tools
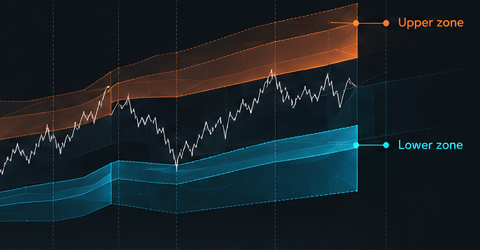
Quant Zones
Areas of interest, calculated and plotted for you. Learn to assess location, extension, and market context.
Build your process
Learn the method
Connect the zones, risk planning, and execution in one structured approach.

Assess participation
Read the tape
Learn to assess buying and selling activity before deciding to act or wait.

Start with context.
Every trading day, before the open, members get the Morning Market Analysis: the macro backdrop, what’s new across the TraderFoundry stock universe, and the two or three names in focus — with the reason each one is there. The same briefing MC reads before his own session.
Market context — overnight moves, scheduled data vs. consensus, and what to watch into the open.
Universe review — new catalysts vs. carry-over themes across the stock universe.
Stocks in focus — the names worth a chart today, and why.
Sample issue · Friday, October 16, 2026 · evidence cutoff 09:00 ET
SPY: Bullish, Medium confidence. QQQ: Mixed, Medium confidence.
“For your first 30 minutes, the useful distinction is AAPL/TSLA strength versus AMD/NFLX weakness, not simply ‘tech up or down.’”
It’s context, not a trade list — the names in focus are a starting point for your own chart work with Quant Zones, risk planning, and tape reading.
Each issue is generated before the open from public news and market data by TraderFoundry’s own pipeline, and published to the member area.
A real session. Multiple zone interactions.
Zones and risk-based sizing plotted for you, with education to help you interpret both.
Calculated for you
The indicator calculates and plots the Quant Zones on your chart — no levels to draw by hand.
Plan your risk
Position-size estimates in options contracts — how many to trade — calculated automatically from your risk settings.
Read context and participation
Learn to combine the zones with market context and tape reading.
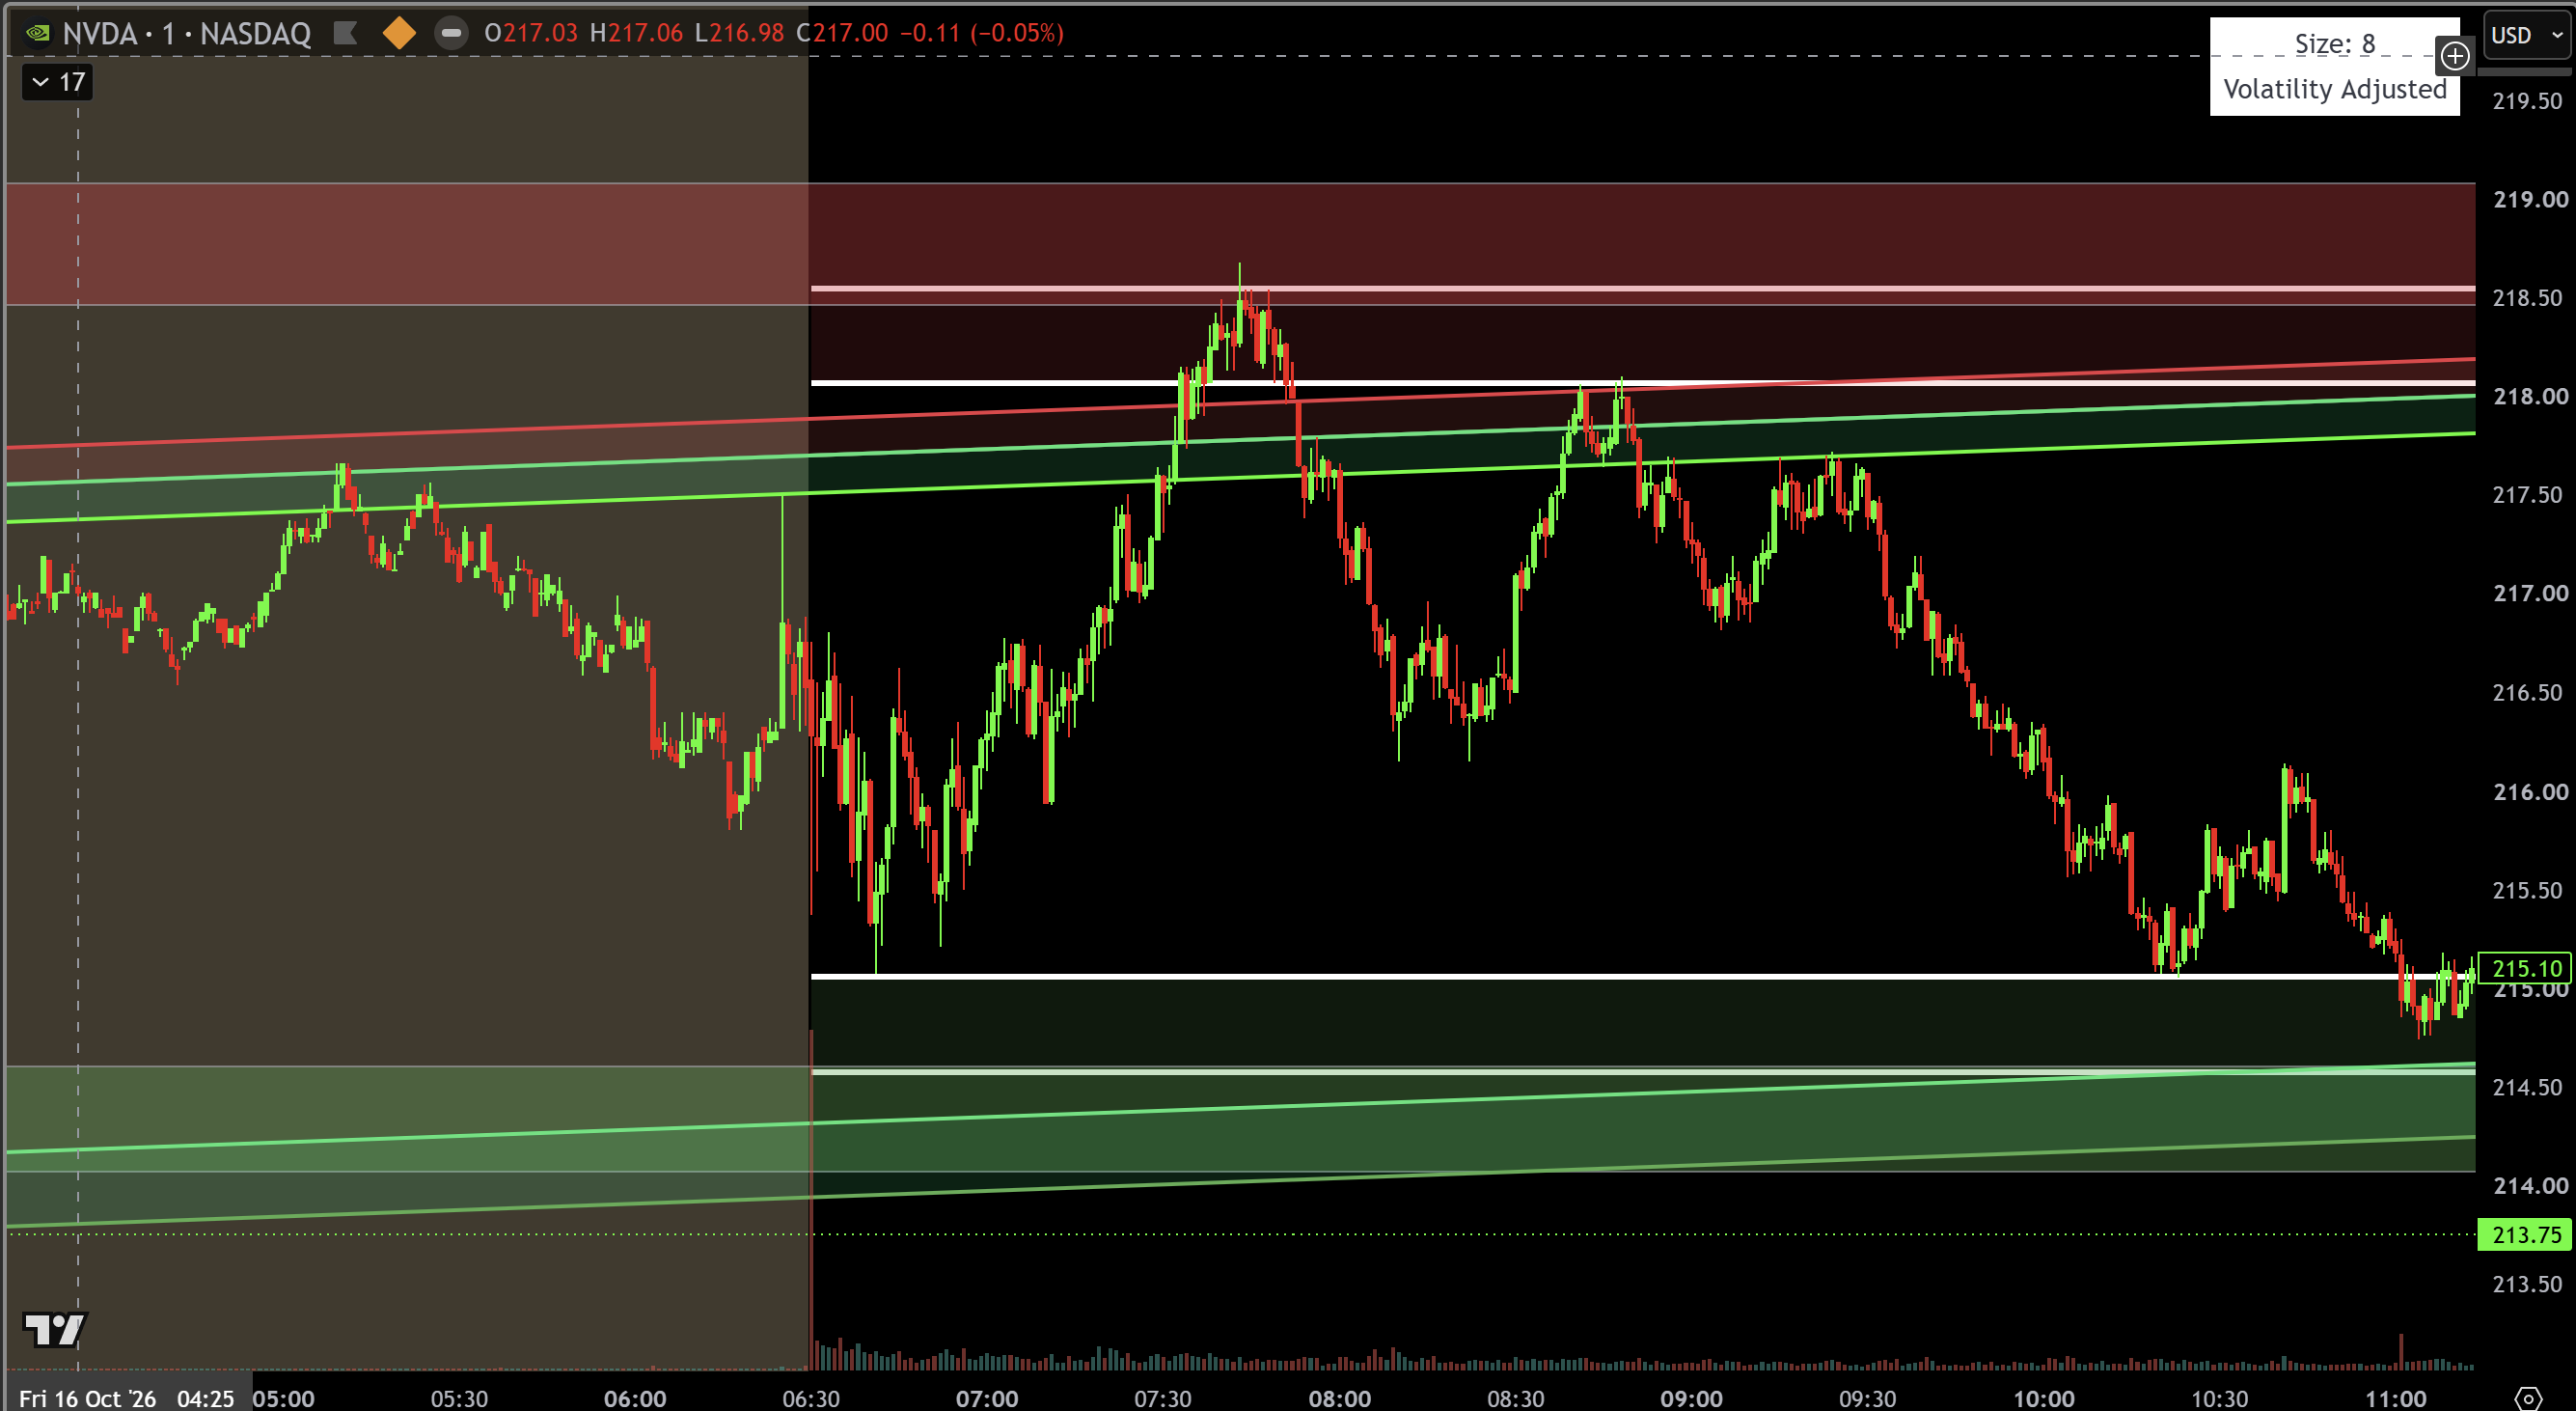
Read this historical chart
This selected historical NVDA session shows price interacting with the plotted zones. Near the opening, price reacts at a volatility boundary. Later, price rises into the upper Quant Zone where it overlaps a volatility boundary, then moves lower.
The chart illustrates locations to assess alongside market context, risk estimates, and tape reading. The zones alone do not determine an entry or exit.
One membership. A connected process.
For newer and developing day traders who know the basics and want a more structured approach to the US open.
Founding membership · Opens Q1 2027
TraderFoundry Membership
Tools, lessons, market context, and community in one package. The first group of members opens in Q1 2027 at a founding-member rate that stays locked for as long as your membership stays active. Pricing goes to the waitlist first.
TradingView indicator
The Quant Zones indicator for TradingView, with options position sizing built in. Requires a paid TradingView plan.
Recorded lessons
Learn the trading method, how to interpret the indicator, and how to assess context and participation.
Community access
Discuss the method, ask questions, and learn alongside other developing traders.
Morning Market Analysis
Market context and the stocks in focus, in the member area before every open.
Live sessions with MC
Join screen shares and market discussions, with session details announced in the community.
Separate enrollment · First cohort shortly after launch
Go deeper with an advanced cohort.
Advanced cohorts are small, time-boxed group programs for members who want more hands-on guidance: a structured curriculum, live sessions, individual reviews of your own trades, and coaching on process — built on top of the membership.
The first cohort opens shortly after the founding membership launches. Dates, program details and pricing go to members and the waitlist first.

Built by a practitioner
Meet MC
Founder of TraderFoundry · Quantitative trader · Certificate in Quantitative Finance (CQF)
MC has spent nearly two decades in software engineering at major technology companies and has traded since 2019. He holds the Certificate in Quantitative Finance (CQF) and built the algorithms behind the Quant Zones for his own trading, before TraderFoundry existed.
He trades the first hour of the US session — the most liquid mega-cap stocks, mostly big tech — and is usually done well before lunch. That first hour is where TraderFoundry lives: it is where the setups he teaches occur, and it is a window a trader with a full schedule can actually keep.
TraderFoundry exists because the tools and the morning preparation he built for himself turned out to be teachable. Members use the same indicator and the same briefing he does, and learn the discretionary part — reading market context and the tape — that no indicator can do for them.
Before you join
A few things to know.
A clear starting point for learning about the membership and the method.
When does it open, and what will it cost?
The founding membership opens in Q1 2027. Pricing is announced to the waitlist before enrollment opens anywhere else, and founding members keep their founding rate for as long as their subscription stays active and in good standing; if it lapses, rejoining is at the then-current price.
Membership renews automatically until you cancel, and first-time members have a 7-day money-back guarantee on their first payment. The details are in our Terms of Service.
Who is TraderFoundry for?
Newer and developing day traders, including those who have struggled so far. You should already understand basic chart reading and candlesticks; chart-pattern and order-flow knowledge are not prerequisites.
The method is built for the first hour of the US stock session in liquid mega-cap names. If you trade futures, forex or crypto, it is not designed for you.
What markets and stocks does TraderFoundry cover?
US stocks and the options on them. The TraderFoundry stock universe is a short, fixed list of the most liquid US mega-cap stocks — mostly big tech — plus SPY and QQQ. The Quant Zones are read on the stock chart, and the method focuses on the first hour after the 9:30 AM ET open, when these names are most active.
The method expresses trades through options contracts on those names, used for leverage, so the indicator’s position sizing is in contracts rather than shares. Options bring added risks — time decay, wider spreads, and the possibility of losing the entire premium — which the lessons cover directly. We do not cover futures, forex or crypto.
What will membership include?
Membership includes the TraderFoundry TradingView indicator, recorded lessons, and community access. Learn to use the Quant Zones and position-size estimates alongside market context and tape reading.
You’ll also get the Morning Market Analysis before every open: market context, what’s new across the stock universe, and the stocks in focus.
When are the live sessions?
When a live session is scheduled, it starts at 9:00 AM ET, before the market opens, and runs into the open. Sessions are not held every day — MC announces the schedule in the community in advance — and they may be recorded for members who can’t attend live.
Which TradingView plan do I need?
The indicator runs on TradingView and requires a paid plan: Plus at a minimum, and Premium is better (more indicators per chart and more alerts). You will also need a real-time US stock data subscription from TradingView — the delayed data on free plans is not usable for trading the open.
Access is invite-only. After you join, you give us your TradingView username and we add the indicator to your account.
What are advanced cohorts?
Advanced cohorts are small, time-boxed group programs that build on the membership: a structured curriculum, live sessions, individual reviews of your own trades, and coaching on process. They are for members who want hands-on guidance beyond the lessons and the community.
The first cohort opens shortly after the founding membership launches in Q1 2027, with separate enrollment and limited seats. Dates and pricing are announced to members and the waitlist first. The cohort builds on the membership’s indicator and morning briefing, so it is designed for existing members.
What will I learn to do with the indicator?
Interpret calculated zones, assess price extension, plan position size in options contracts from your own risk settings, and combine the chart with market context and tape reading. You make the trade decisions and manage execution.
Founding membership opens Q1 2027
Join the TraderFoundry waitlist.
Waitlist members get first access and founding-member pricing, locked in for as long as you stay a member. Launch details go to the waitlist first.
By joining, you agree to receive emails from TraderFoundry and to our Privacy Policy and Terms of Service, linked below. Unsubscribe anytime.
Education & trading risk
TraderFoundry provides trading education and quantitative tools for general educational and informational purposes. Content, indicators, lessons, and live discussions are not personalized investment advice or recommendations to buy, sell, or hold any security. You are responsible for your own trading decisions.
Day trading, including options trading, involves substantial risk and can result in the loss of your entire trading capital. Consistent profitability is difficult and is not guaranteed. Any trades, examples, or results shared by MC are illustrative and should not be treated as typical results or outcomes you can expect to achieve. Past performance does not predict future results.
Historical charts are selected educational examples, not a verified record of executed trades. Position-size calculations and risk levels are estimates; slippage, market gaps, and changing option prices can cause actual losses to exceed planned amounts. Trade only with money you can afford to lose.
Accessibility & assistance
TraderFoundry is working to make our website accessible to people with disabilities, guided by the Web Content Accessibility Guidelines (WCAG) 2.2 Level AA.
If you experience difficulty accessing our website or need information in another format, please email [email protected]. Include the page address and a brief description of the assistance you need.